Infographics

Increased sediment fluxes due to modern climate change and cryosphere degradation

Infographic to show the yearly breakdown of Nature Reviews Physics

The diversity challenge, another graphic in the year in review series (see above)
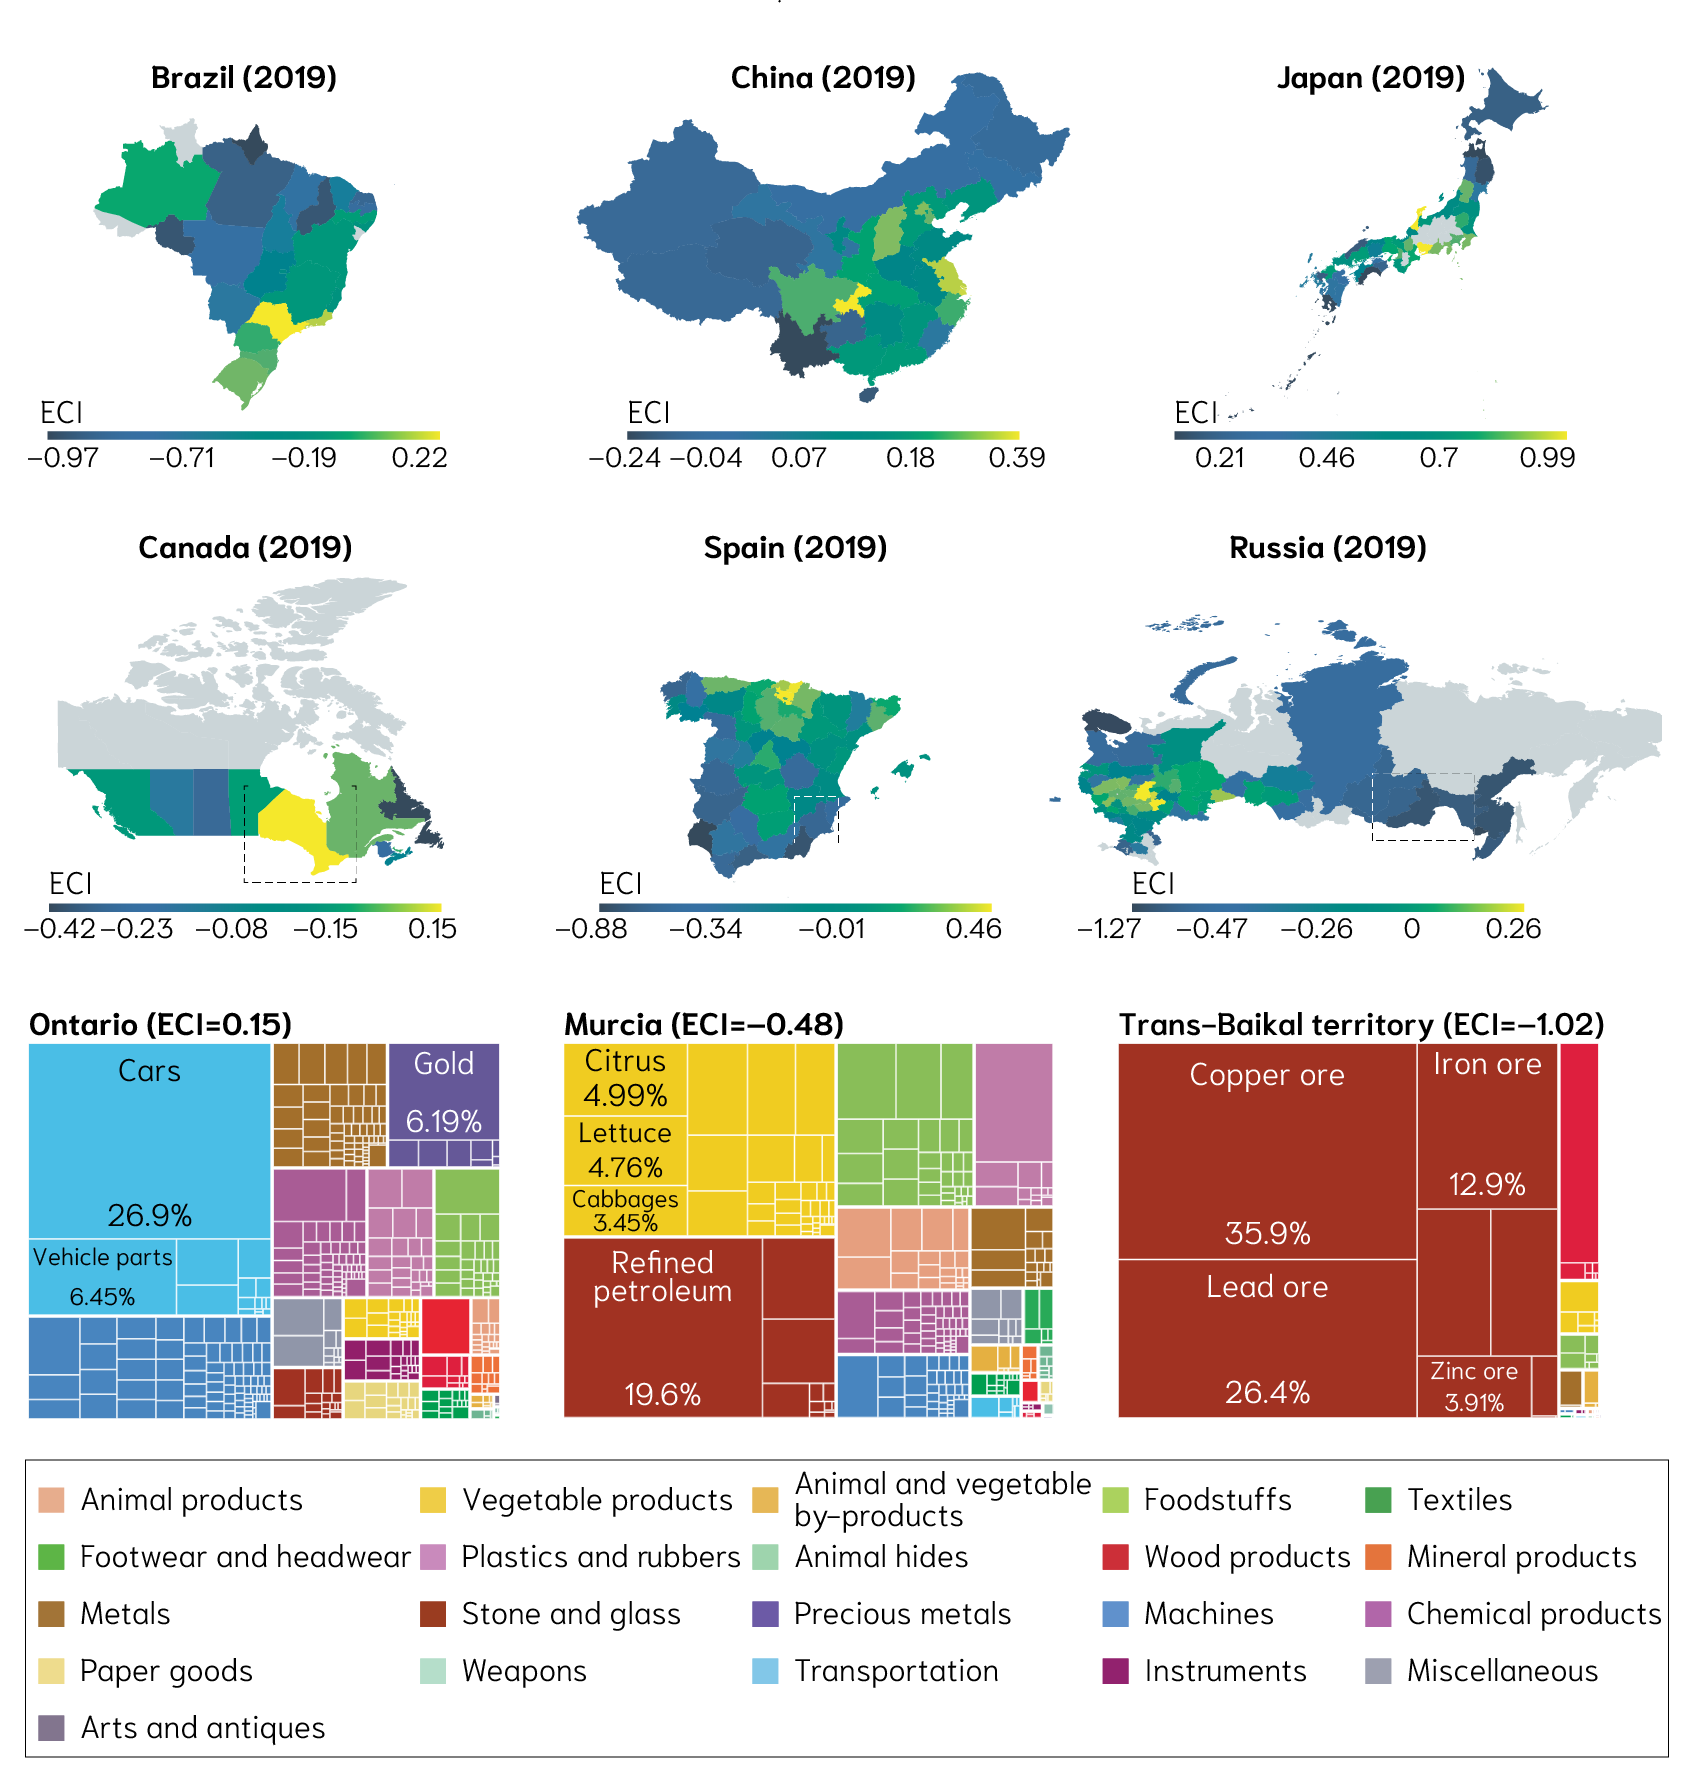
The maps use international trade data to depict the Economic Complexity Index (ECI) for regions in Brazil, China, Japan, Canada, Spain and Russia. The maps were made in QGIS and then illustrator, and RAWGraphs was used to make the tree maps

The infographic to show the following yearly breakdown of Nature Reviews Physics

Capital and operating expenditure breakdowns and money sources in the water world

Alluvial graph showing the why, who, and how of social touch. This was made with RAWGraphs

Percentage of female startup founders in Europe and North America
